13 min to complete
This lesson touches on ScyllaDB Monitoring. For a more in-depth lesson, check out the ScyllaDB Monitoring lesson.
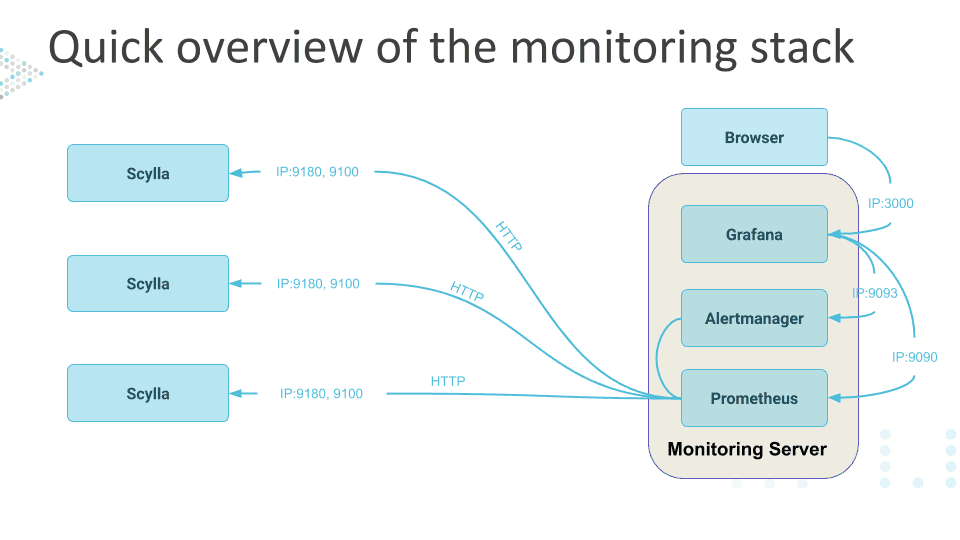
The ScyllaDB Monitoring stack runs in Docker and consists of Prometheus and Grafana containers. Prometheus is an open-source system monitoring and alerting toolkit used to gather metrics from the ScyllaDB cluster. Grafana is an open-source analytics platform that will allow us to visualize the data in Graphs from Prometheus. ScyllaDB Monitoring will communicate with the ScyllaDB cluster in this exercise because all components will be on the same virtual network.
If you have a cluster in production, it’s highly recommended to monitor it. With ScyllaDB Monitoring, you monitor Internal DB metrics such as load, throughput, latency, reads, writes, cache hits and misses, and more. Linux metrics are also recorded, such as disk activity, utilization, and networking.
The monitoring lab is now part of the Monitoring and Manager lab.


